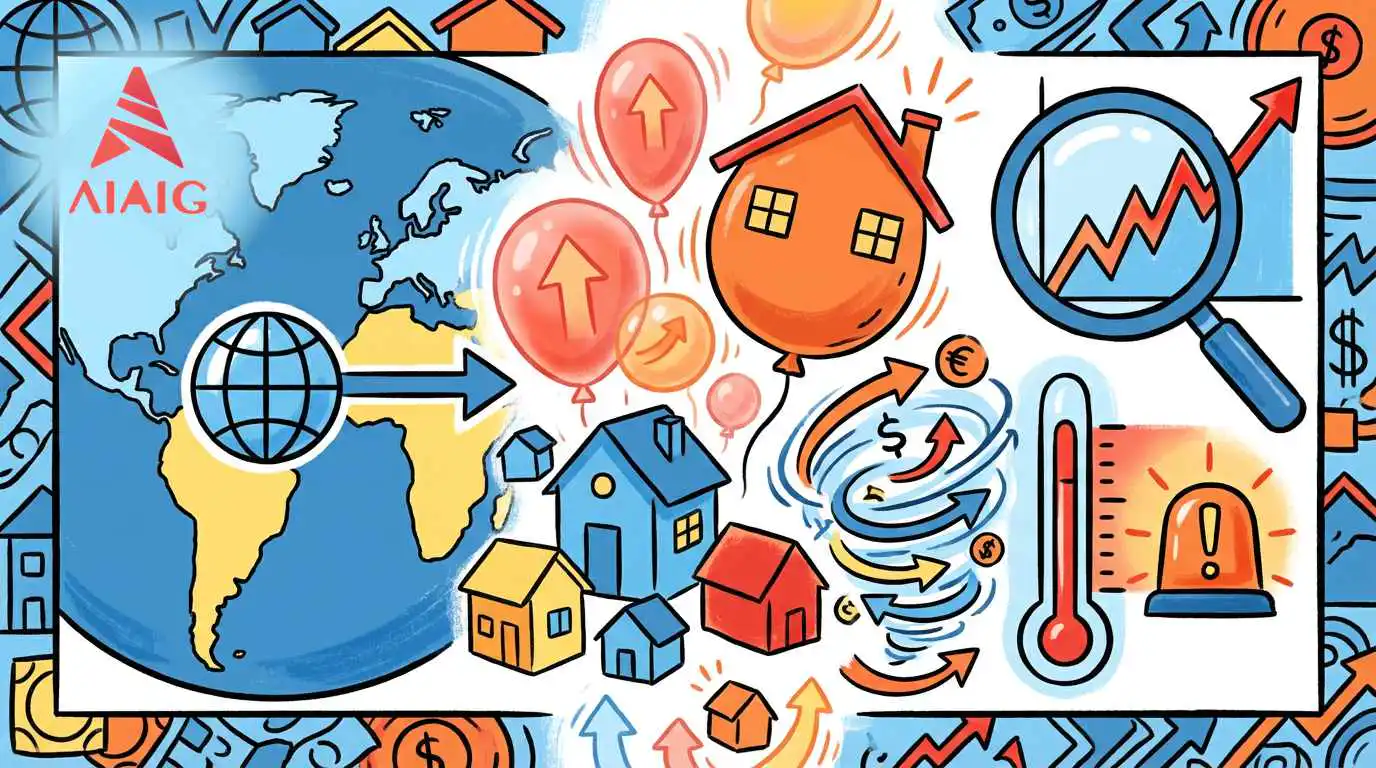
2024 Global Survey of Asset Bubbles in Major Overseas Real Estate Investment Regions
This article systematically reviews the asset bubble risks in the overseas real estate market over the past year, focusing on Southeast Asia (Thailand, Malaysia, Vietnam, Singapore), the Middle East (Dubai), developed countries (Japan, the UK), and highly internationalized cities (Hong Kong).
Without losing information, this article emphasizes providing: price-to-income ratios, price-to-rent ratios, deviations from historical averages, year-over-year price changes, and combines international bubble indices and institutional perspectives to qualitatively grade risks and analyze investment implications for each market.
【Quick Conclusion Overview】
- High bubble/high valuation areas: Tokyo, Singapore (private residential), Dubai, Hong Kong (despite significant corrections).
- Moderate risk areas: Singapore overall, some major cities in Thailand and Vietnam (high volatility in specific sectors).
- Low bubble risk areas: Malaysia, the UK overall (London is in a high-level slowdown phase).
For Chinese investors, the above markets correspond to different risk-return characteristics: some are known for high rental yields and high volatility (such as Dubai, some Vietnamese cities), some focus on financial centers and asset safe-haven attributes (such as Singapore, Tokyo, London, Hong Kong), and others lean towards allocation markets with "acceptable yields + moderate appreciation" (such as Malaysia, Thailand).
- Which regions and time frames does this research cover?
- 1. Regional scope:
- Southeast Asia: Thailand, Malaysia, Vietnam, Singapore.
- Middle East: Dubai (UAE).
- Developed countries: Japan (represented by Tokyo), UK (represented by London).
- Highly internationalized city: Hong Kong.
2. Time frame:
- Focused on the past year or so, with 2024 as the core timeline, incorporating the latest statistical data and institutional perspectives extending into early 2025 to assess the overall bubble status around 2024.
3. Target audience:
- Primarily aimed at Chinese investors interested in overseas real estate investment, asset allocation, or medium- to long-term relocation planning. - What do the price-to-income ratio, price-to-rent ratio, deviation from historical average, and annual price growth rate each represent?
- 1. Price-to-Income Ratio:
- Measures how many times the price of a home is relative to the local household's annual income.
- A higher value indicates a heavier burden for homebuyers, serving as an intuitive indicator of whether housing is "expensive."
2. Price-to-Rent Ratio:
- The multiple of home price to annual rent, commonly calculated as: home price ÷ annual rent.
- It can generally be used to estimate the gross rental yield ≈ 1 ÷ price-to-rent ratio.
- A higher price-to-rent ratio means lower yield, greater speculative components, and a higher likelihood of bubble accumulation.
3. Deviation of actual home prices from historical average:
- Compares the current home price index (adjusted for inflation) with the average level over the past approximately 10 years; a higher deviation indicates prices are more "detached from historical norms."
- However, not all countries have complete, publicly available quantitative deviation data.
4. Annual home price growth rate:
- The year-over-year increase or decrease in home prices over the past year.
- Excessively high short-term growth is often a typical signal of a bubble phase, while sustained multi-year declines usually indicate bubble clearance or structural adjustments. - What are the data sources and limitations?
- 1. Diverse data sources:
- City/national home price indices and statistical bureau data, used to obtain annual growth rates and price levels.
- Price and rent databases, used to estimate price-to-income and price-to-rent ratios.
- International bubble indices and institutional reports, used to obtain qualitative bubble risk ratings for various cities.
2. Differences in methodology:
- Price-to-income ratios may be based on "city center apartments" or "city-wide averages," leading to variations between different statistical sources.
- Home price growth rates may be benchmarked against "national residential indices" or represented by "core city apartment indices," and should be understood as "representative data" rather than a single definitive answer.
3. Incomplete historical average deviation data:
- Many markets do not publicly disclose detailed data on "the percentage deviation of current prices from the past 10-year average," so this article provides numbers where quantifiable and uses qualitative descriptions like "above/close to/below historical average" where not.
4. Positioning of this article:
- All conclusions are research-based judgments and not investment advice; investors should still conduct further due diligence based on their own risk tolerance and specific projects.
Southeast Asia Overall Perspective: Thailand, Malaysia, Vietnam, Singapore
Southeast Asia is currently a region of high interest for Chinese investors, with significant differences in housing price-to-income ratios, rent-to-sale ratios, and bubble risks across different countries. The overall characteristics are: some cities have relatively high prices but are still in a growth phase, while some countries are in a mild stage of "slow growth or slight adjustment."
- What are the current price-to-income ratio, rent-to-price ratio, and the recent one-year price changes in Thailand's real estate?
- 1. Price-to-income ratio:
- The overall price-to-income ratio in Thailand is approximately 23.8.
- In Bangkok, as a representative example, apartment prices are roughly equivalent to about 21 times the annual income of local households, indicating significant pressure for local first-time homebuyers.
2. Rent-to-price ratio / Price-to-rent ratio:
- In Bangkok's city center and suburbs, the rent-to-price ratio is around 32 times: approximately 32.7 in the city center and 32.0 in the suburbs.
- This corresponds to a gross rental yield of about 3% (1/32 ≈ 3.1%), transitioning from an early "high-yield emerging market" to a level typical of mature major cities.
3. Recent one-year price changes:
- Nationwide residential prices have shown a moderate overall increase around 2024.
- By the second quarter of 2025, the national housing price index rose by about 2.7% year-on-year, reflecting more of a "moderate recovery" post-pandemic and under policy stimulus, rather than explosive growth.
4. Relative to historical averages:
- Public data rarely provides precise "percentage deviation from the past 10-year average." From the trend, overall prices are closer to recovering from pandemic lows back to near long-term averages, rather than surging far above them. - What is the overall level of real estate bubble risk in Thailand, and what does it mean for overseas investors?
- 1. Overall bubble risk is manageable:
- Mainstream international bubble indices do not classify Thailand as a typical "high bubble risk" market.
- Although the price-to-income ratio is not low, price increases have been relatively moderate over the past year or more, and the government continues to regulate loan-to-value ratios and purchase qualifications to curb excessive leverage.
2. Implications for overseas investors:
- Thailand is more in a phase of recovery from the "pandemic bottom" back toward the "long-term average," rather than at a bubble peak.
- For investors aiming for long-term holding, rental income, and potential appreciation, strategic location and product selection (e.g., near subway lines, commercial areas, educational and medical resources) are more important than "betting on short-term gains."
3. Risk points:
- Local purchasing power is limited, with high dependence on tourism and external demand; macroeconomic fluctuations and exchange rate changes may lead to periodic price corrections.
- Excessive leverage or over-concentration in a single city or product line could amplify risks.
- What are the house price-to-income ratio, rent-to-price ratio, and 2024 house price trends in Malaysia? Are bubble signals strong?
- 1. House price-to-income ratio:
- The overall house price-to-income ratio in Malaysia is about 8.9, which falls into the lower-pressure category among the multiple markets surveyed.
2. Rent-to-price ratio / Price-to-rent ratio:
- The national average rent-to-price ratio is roughly around 23 times, with about 23.1 in city centers.
- This corresponds to a gross rental yield of approximately 4.3% (1/23 ≈ 4.35%), which is significantly higher than in high-priced markets like Singapore and Hong Kong.
3. 2024 annual house price growth rate:
- The national house price index increased by about 1.4% year-on-year in 2024.
- After accounting for inflation, real house prices slightly declined, at approximately -0.27%.
4. Relative to historical average:
- There is a lack of precise public data on "deviation from the 10-year average," but the overall trend shows slow upward movement or minor fluctuations, with no obvious "vertical surge" phase.
5. Bubble signal assessment:
- With a moderate house price-to-income ratio, reasonable rent-to-price ratio, and mild price increases, the market does not exhibit clear systemic bubble characteristics overall.
- International institutions' reports also rarely list Malaysia as a "high-bubble" market. - What are the current house price-to-income ratios and growth rates in major Vietnamese cities (Ho Chi Minh City, Hanoi)? How are bubbles and risks assessed?
- 1. House price-to-income ratio:
- Represented by Ho Chi Minh City, the house price-to-income ratio is roughly around 25 times, making it a typical high-barrier city, with some statistics approaching or even exceeding those of certain developed countries' first-tier cities.
2. House price changes and volatility:
- Reports indicate that some apartment projects in Hanoi experienced annual growth rates as high as about 29.6% during certain periods, falling into the extremely high growth category.
- Overall house prices in Ho Chi Minh City were roughly flat or slightly rising by the end of 2024, with volatility relatively lower than in Hanoi but still showing periodic hotspots.
3. Relative to historical average:
- Vietnam lacks unified, long-term public data on a national house price index, making it difficult to precisely quantify the deviation from the 10-year average.
- However, the high growth rates in local projects and cities indicate significant valuation increases and speculative elements in certain segments.
4. Bubble and risk assessment:
- Although international indices do not list Vietnam among the most typical "global bubble cities," some cities and segments exhibit characteristics of high volatility, high leverage, and policy uncertainty combined.
- For foreign investors, Vietnam is closer to a "high-growth + high-volatility" market: there are opportunities, but one must accept potentially significant price corrections and risks related to institutional and liquidity aspects.
- What is the current price-to-income ratio and price-to-rent ratio in Singapore? What are the differences between HDB and private residential properties?
- 1. HDB (Public Housing) vs Private Residential Properties:
- Due to government subsidies and policy support, HDB has a relatively lower price-to-income ratio, generally considered to be below 5 times, still within the moderate affordability range.
- Private condominiums and luxury properties are far more expensive than HDB, being the key sector driving up the overall city's price-to-income ratio.
2. Overall Price-to-Income Ratio:
- At the city-wide level, Singapore's price-to-income ratio is approximately 22.4, which is relatively high globally, similar to or even higher than some major financial centers in Europe and the US.
3. Price-to-Rent Ratio:
- The price-to-rent ratio in the city center and popular areas is around 32 times, with the city center at about 32.2.
- This corresponds to a gross rental yield of around 3%, which is typical for mature, developed financial centers. - What has been the price increase in Singapore over the past year, and how does it deviate from historical averages?
- 1. 2024 Price Increase:
- HDB resale prices rose by approximately 9.6% year-on-year in 2024, significantly higher than the about 4.9% increase in 2023, indicating a new round of price acceleration.
- The private residential market showed similar upward trends, also in a high range, suggesting that the price rise is not limited to a single sector.
2. Deviation from Historical Averages:
- Looking at the price trends over the past decade, Singapore's overall property prices are now significantly above the 10-year average, with many sectors at or near historical highs.
- Despite multiple rounds of cooling measures and stamp duty policies, prices have remained high or even continued to rise, indicating strong demand from both end-users and capital inflows. - What is Singapore's position in international bubble indices, and what regulatory measures has the government implemented?
- 1. Position in International Bubble Indices:
- In global real estate bubble indices, Singapore is typically classified as a "moderate risk" city, not in the highest "bubble risk" category.
- This indicates that while prices are high, they are still somewhat supported relative to income, rent, and economic fundamentals.
2. Government Regulatory Measures:
- Imposing high stamp duties on foreign buyers, second-time, and multiple-property buyers is one of the core measures to control speculation.
- Adjusting loan-to-value ratios, down payment requirements, and regularly introducing "cooling measures" to curb excessive price increases.
3. Implications for Investors:
- Singapore assets combine "safe haven + global financial center" attributes, suitable for investors prioritizing safety and long-term allocation.
- However, given the already high valuations, long-term returns are expected to be significantly lower than in high-volatility emerging markets, playing more of a "preservation + modest appreciation" role.
Dubai: High Growth, High Returns, and Rising Risks
Dubai has experienced strong property price increases in recent years and still offers relatively high rental yields globally, but at the same time, prices have approached or returned to previous peaks, and bubble risks are resurfacing.
- What is the current situation regarding Dubai's price-to-income ratio, rent-to-price ratio, and rental yield?
- 1. Price-to-income ratio:
- There is currently a lack of publicly available unified data for Dubai's "national price-to-income ratio," with most statistics measured separately by different communities and projects.
2. Rent-to-price ratio / Rental yield:
- In global comparisons among major cities, Dubai's price-to-rent ratio is at a relatively low level, meaning the rent-to-price ratio is low and the rental yield is high.
- The market generally believes that the gross rental yield for Dubai's core apartments is roughly in the range of 5%–7%, significantly higher than the 2%–3% level in most developed cities.
3. Summary of characteristics:
- Dubai combines features of "global capital inflow + tax system attractiveness + high yield," but the supply of new developments is also very large, making it a typical high-yield, high-volatility market. - How has Dubai's housing price increased over the past year, and what is its position compared to historical highs?
- 1. Recent year's increase:
- Housing price indices show that Dubai's residential prices increased by approximately 15.6% year-on-year in 2024, placing it among the cities with higher growth rates globally.
- Data from some platforms by early 2025 indicate that the average apartment price still had about a 12% increase compared to the same period the previous year, suggesting that the upward momentum remains strong in the short term.
2. Comparison with historical highs:
- Currently, Dubai's residential prices have largely returned to levels near the previous real estate peak around 2014.
- This means that the space released during the last adjustment has been largely refilled, and the market has re-entered the "historical high range." - How do international institutions assess Dubai's bubble risk, and what does this mean for investors?
- 1. Bubble risk rating:
- In earlier cycles, Dubai was considered a "moderate-risk" market; with the significant price increases in recent years, the latest views generally suggest that its risk has risen to a relatively high level.
- Some institutions explicitly warn that while there are high yields and high growth rates, the sensitivity of prices to external shocks is also increasing.
2. Expectations for future trends:
- Multiple analyses predict that starting in the second half of 2025, Dubai's real estate may experience a mild adjustment, partially digesting previous gains through a "slight correction" rather than a systemic crash.
3. Implications for investors:
- There is still potential for high rental yields and capital gains in the short term, but the market is already in the latter half of the cycle.
- It is more suitable for investors with clear holding periods, knowledge of cycle exit strategies, and strong risk tolerance; conservative investors should be cautious about chasing highs at elevated levels.
Japan (Tokyo): High Bubble Risk but Relatively Stable Financial System
Japan overall has an aging population and long-term low interest rates, but Tokyo, as a core city, has seen significant housing price increases in recent years and has been listed by multiple institutions as one of the high bubble risk cities.
- What are the current levels of the price-to-income ratio and rent-to-price ratio in Tokyo?
- 1. Price-to-income ratio:
- The price-to-income ratio in Tokyo is approximately 15 times, roughly equivalent to other first-tier Asian cities like Seoul.
- For ordinary local families, purchasing a self-owned home in Tokyo's core areas has become a significant financial burden.
2. Rent-to-price ratio and yield:
- The rent-to-price ratio for most residential properties in Tokyo is slightly higher than in some European and American cities, but it still remains in a relatively high range, with gross rental yields typically around 3% or slightly lower.
- Under Japan's long-term low-interest-rate environment, this yield still holds some appeal, especially for domestic institutions and long-term investors. - How has Tokyo's housing price increased over the past year? How does it deviate from the average over the past decade?
- 1. Recent year's increase:
- At the beginning of 2024, multiple institutions projected an annual housing price increase in Tokyo of about 8%, and actual transaction data indicates that this level has been roughly achieved or even slightly exceeded.
- By mid-2025, some statistics show that the price of second-hand apartments in Tokyo has increased by approximately 12.6% year-on-year, indicating that the upward momentum continues.
2. Relative to historical average:
- Looking at price trends over the past decade or more, Tokyo's current housing prices are significantly higher than the 10-year average, with core area mid-to-high-end apartments frequently reaching new historical highs.
- The price rise is not a one-time surge but rather the result of years of moderate increases combined with acceleration in the past two years. - How do international bubble indices assess Tokyo? What does this mean for overseas investors?
- 1. High bubble risk city:
- In global real estate bubble indices, Tokyo is often listed as one of the "high bubble risk" cities, with its housing prices considered to have significantly deviated from levels supported by income and rent.
2. Risk characteristics:
- Japan has maintained ultra-low interest rates for a long time; if interest rates rise significantly in the future or global capital flows change, Tokyo's housing price sensitivity to interest rates could be amplified.
- However, Japan's financial system and household leverage are generally stable, making the probability of a systemic financial crisis relatively low, with risks more focused on valuation adjustments and yield declines.
3. Implications for overseas investors:
- Tokyo is suitable as an allocation target for "developed country core assets + stable rental market," rather than a mere short-term speculation object.
- It is more suitable for medium- to long-term investors focused on asset preservation and currency diversification, emphasizing location selection (such as transportation, school districts, employment centers, medical resources) to enhance long-term risk resilience.
United Kingdom (London): A Mature Market Slowing from High Levels
Overall house prices in the UK remain at historically high levels, but after the rapid increases of previous years, they have entered a phase of 'slowing from high levels' around 2024, with particularly limited growth in London.
- What are the current price-to-income ratio and price-to-rent ratio for the UK as a whole and London?
- 1. UK overall price-to-income ratio:
- The national price-to-income ratio is approximately 8.7, which is at a medium-high level but significantly lower than that of Asian super-first-tier cities like Hong Kong and Singapore.
2. Price-to-rent ratio:
- The overall price-to-rent ratio in the UK is about 19.8 times, corresponding to a gross rental yield of around 5% (1/19.8 ≈ 5.05%).
- The actual yield in central London is typically slightly lower than the national average due to higher property prices and limited rental growth. - What is the trend of UK house prices in 2024? How do London and the national market differ?
- 1. National house price increase:
- In 2024, the average house price in the UK increased by approximately 3.4% year-on-year, indicating a moderate rise.
2. London:
- During the same period, the average house price in London increased by about 0.2% year-on-year, essentially showing a "flat or slight increase."
- This suggests that London has shown some fatigue at high levels and is no longer the main driver of national house price growth. - How do international institutions assess the bubble risk in the UK (especially London)? What does this mean for investors?
- 1. Low bubble risk rating:
- In global bubble indices, London is typically in the "low bubble risk" or "overvalued but manageable" range.
- Although property prices are high, they are somewhat supported by the UK's overall income levels, demographic structure, and status as a financial center.
2. Regulatory and central bank perspective:
- The Bank of England monitors the impact of the housing market recovery on financial stability but generally considers the risks limited. London has undergone years of regulation and slowing growth, with some valuation bubbles already absorbed.
3. Implications for investors:
- The UK, especially London, is better viewed as a "high-price, low-growth" mature market, focusing on asset safety and currency diversification rather than short-term appreciation.
- Chinese investors need to comprehensively consider factors such as exchange rates, stamp duty, holding costs, and rental returns, and should not simply base future expectations on historical gains.
Hong Kong: A High-Level Correction Market After Bubble Clearance
Hong Kong has long been at the extreme highs of global price-to-income and rent-to-price ratios, making it one of the typical "bubble cities." After experiencing significant declines in recent years, some bubbles have been cleared, but absolute prices and affordability remain very high.
- How high are Hong Kong's current price-to-income ratio and price-to-rent ratio? Where does it rank globally?
- 1. Price-to-income ratio:
- Hong Kong's price-to-income ratio is approximately 25 times, consistently ranking among the world's least affordable cities.
2. Price-to-rent ratio:
- The price-to-rent ratio in Hong Kong's city center is about 106.9 times, one of the highest globally.
- The corresponding gross rental yield is only around 1%, significantly lower than the typical 4%–6% in emerging markets and also below the 2%–3% in most developed cities.
3. Global comparison tier:
- Even after significant corrections, Hong Kong remains in the combination of "extremely high prices and extremely low yields," making it one of the most extreme residential markets globally. - How much have Hong Kong's property prices fallen in the past one to two years? How does this compare to the past decade or the previous peak?
- 1. Recent year's decline:
- In various quarters of 2024, Hong Kong's property prices fell year-on-year by approximately -6.9% to -12.9%, indicating a relatively significant and sustained downturn cycle.
- By the first quarter of 2025, the year-on-year price decline was still about -7.8%, suggesting prices have not fully stabilized.
2. Relative to the past decade's levels:
- After years of adjustments, some assessments suggest that current Hong Kong property prices have roughly returned to levels around 2012.
- This means part of the long-term accumulated bubble from the previous cycle has been cleared, but absolute prices remain very high. - What changes have occurred in Hong Kong's position in international bubble indices? What does this mean for the future and investors?
- 1. Bubble risk shifted from extreme to moderate:
- In the past, Hong Kong was often seen as one of the most typical bubble cities; after years of declines and policy adjustments, it is now typically rated as "moderate risk."
2. Uncertainty in future trends:
- From a valuation perspective, the room for further sharp declines has significantly narrowed compared to previous years, but due to multiple factors such as the economy, population, and geopolitics, it is difficult to return to previous highs in the short term.
- A more likely scenario is continued volatility within a wide range, repeatedly digesting inventory and policy impacts.
3. Implications for investors:
- Hong Kong real estate has transitioned from a phase of "high bubble + high crash risk" to one of "high prices + high uncertainty but with some bubble cleared."
- Investors need to pay extra attention to their tolerance for fluctuations in exchange rates, taxes, and rents, and more carefully choose between self-use vs. investment, residential vs. commercial properties, and core vs. non-core areas.
【Horizontal Comparison and Investor Usage Guide】
- Three groups from the bubble risk perspective:
- High-risk/high-valuation group: Tokyo, Singapore (especially private housing), Dubai, Hong Kong.
- Characteristics: High price-to-income ratio, significant recent price increases in some cities, or extreme high valuations in the past (Hong Kong), vulnerable to interest rates and external shocks.
- Moderate-risk group: Major cities in Thailand, some cities in Vietnam, Singapore overall.
- Characteristics: High but mostly moderate or regionally concentrated price increases, some in post-pandemic recovery stages, with active policy regulation.
- Low bubble risk group: Malaysia, the UK overall (London shows high-level slowdown, not another surge).
- Characteristics: Relatively moderate price-to-income ratio and price increases, reasonable or slightly high rent-to-price ratio, reflecting more of a "slow bull or fluctuation" in mature markets.
- How different types of Chinese investors can use this information:
- Those pursuing high returns and accepting high volatility:
- Focus on researching Dubai, some cities in Vietnam, and specific sectors in Thailand, leveraging high rental yields and cyclical price fluctuations, but must have strong financial and psychological resilience.
- Those inclined toward asset safety and currency diversification:
- Pay close attention to mature financial centers like Singapore, Tokyo, London, and Hong Kong, viewing them as "high-priced but highly liquid" assets, with emphasis on controlling leverage and holding costs.
- Those seeking a balance of yield and moderate risk in allocation:
- Malaysia and some cities in Thailand may offer relatively balanced combinations between yield and valuation, suitable as "medium-risk, medium-return sectors" for Southeast Asian allocation.
- Precautions when using this report:
- Various indicators are mostly based on representative data and public statistics; specific projects may differ significantly from city averages.
- Policy changes, monetary environment, and exchange rate fluctuations can significantly impact medium- to long-term returns, requiring continuous monitoring.
- Before making investment decisions, it is recommended to conduct secondary due diligence considering local laws, taxes, property management, and actual rental conditions.
Last updated Dec 11, 2025