India 2026 New Economic Signals: Housing Index 104.51 Higher, Confidence 96.50, Industrial Output +7.30% - South Asia Growth Engine Allocation
India Q1 GDP grew 7.80%; housing index rose to 104.51; July confidence improved to 96.50; June industrial output +7.30% and FDI $6.068B - decoding the allocation logic of the South Asia growth engine.
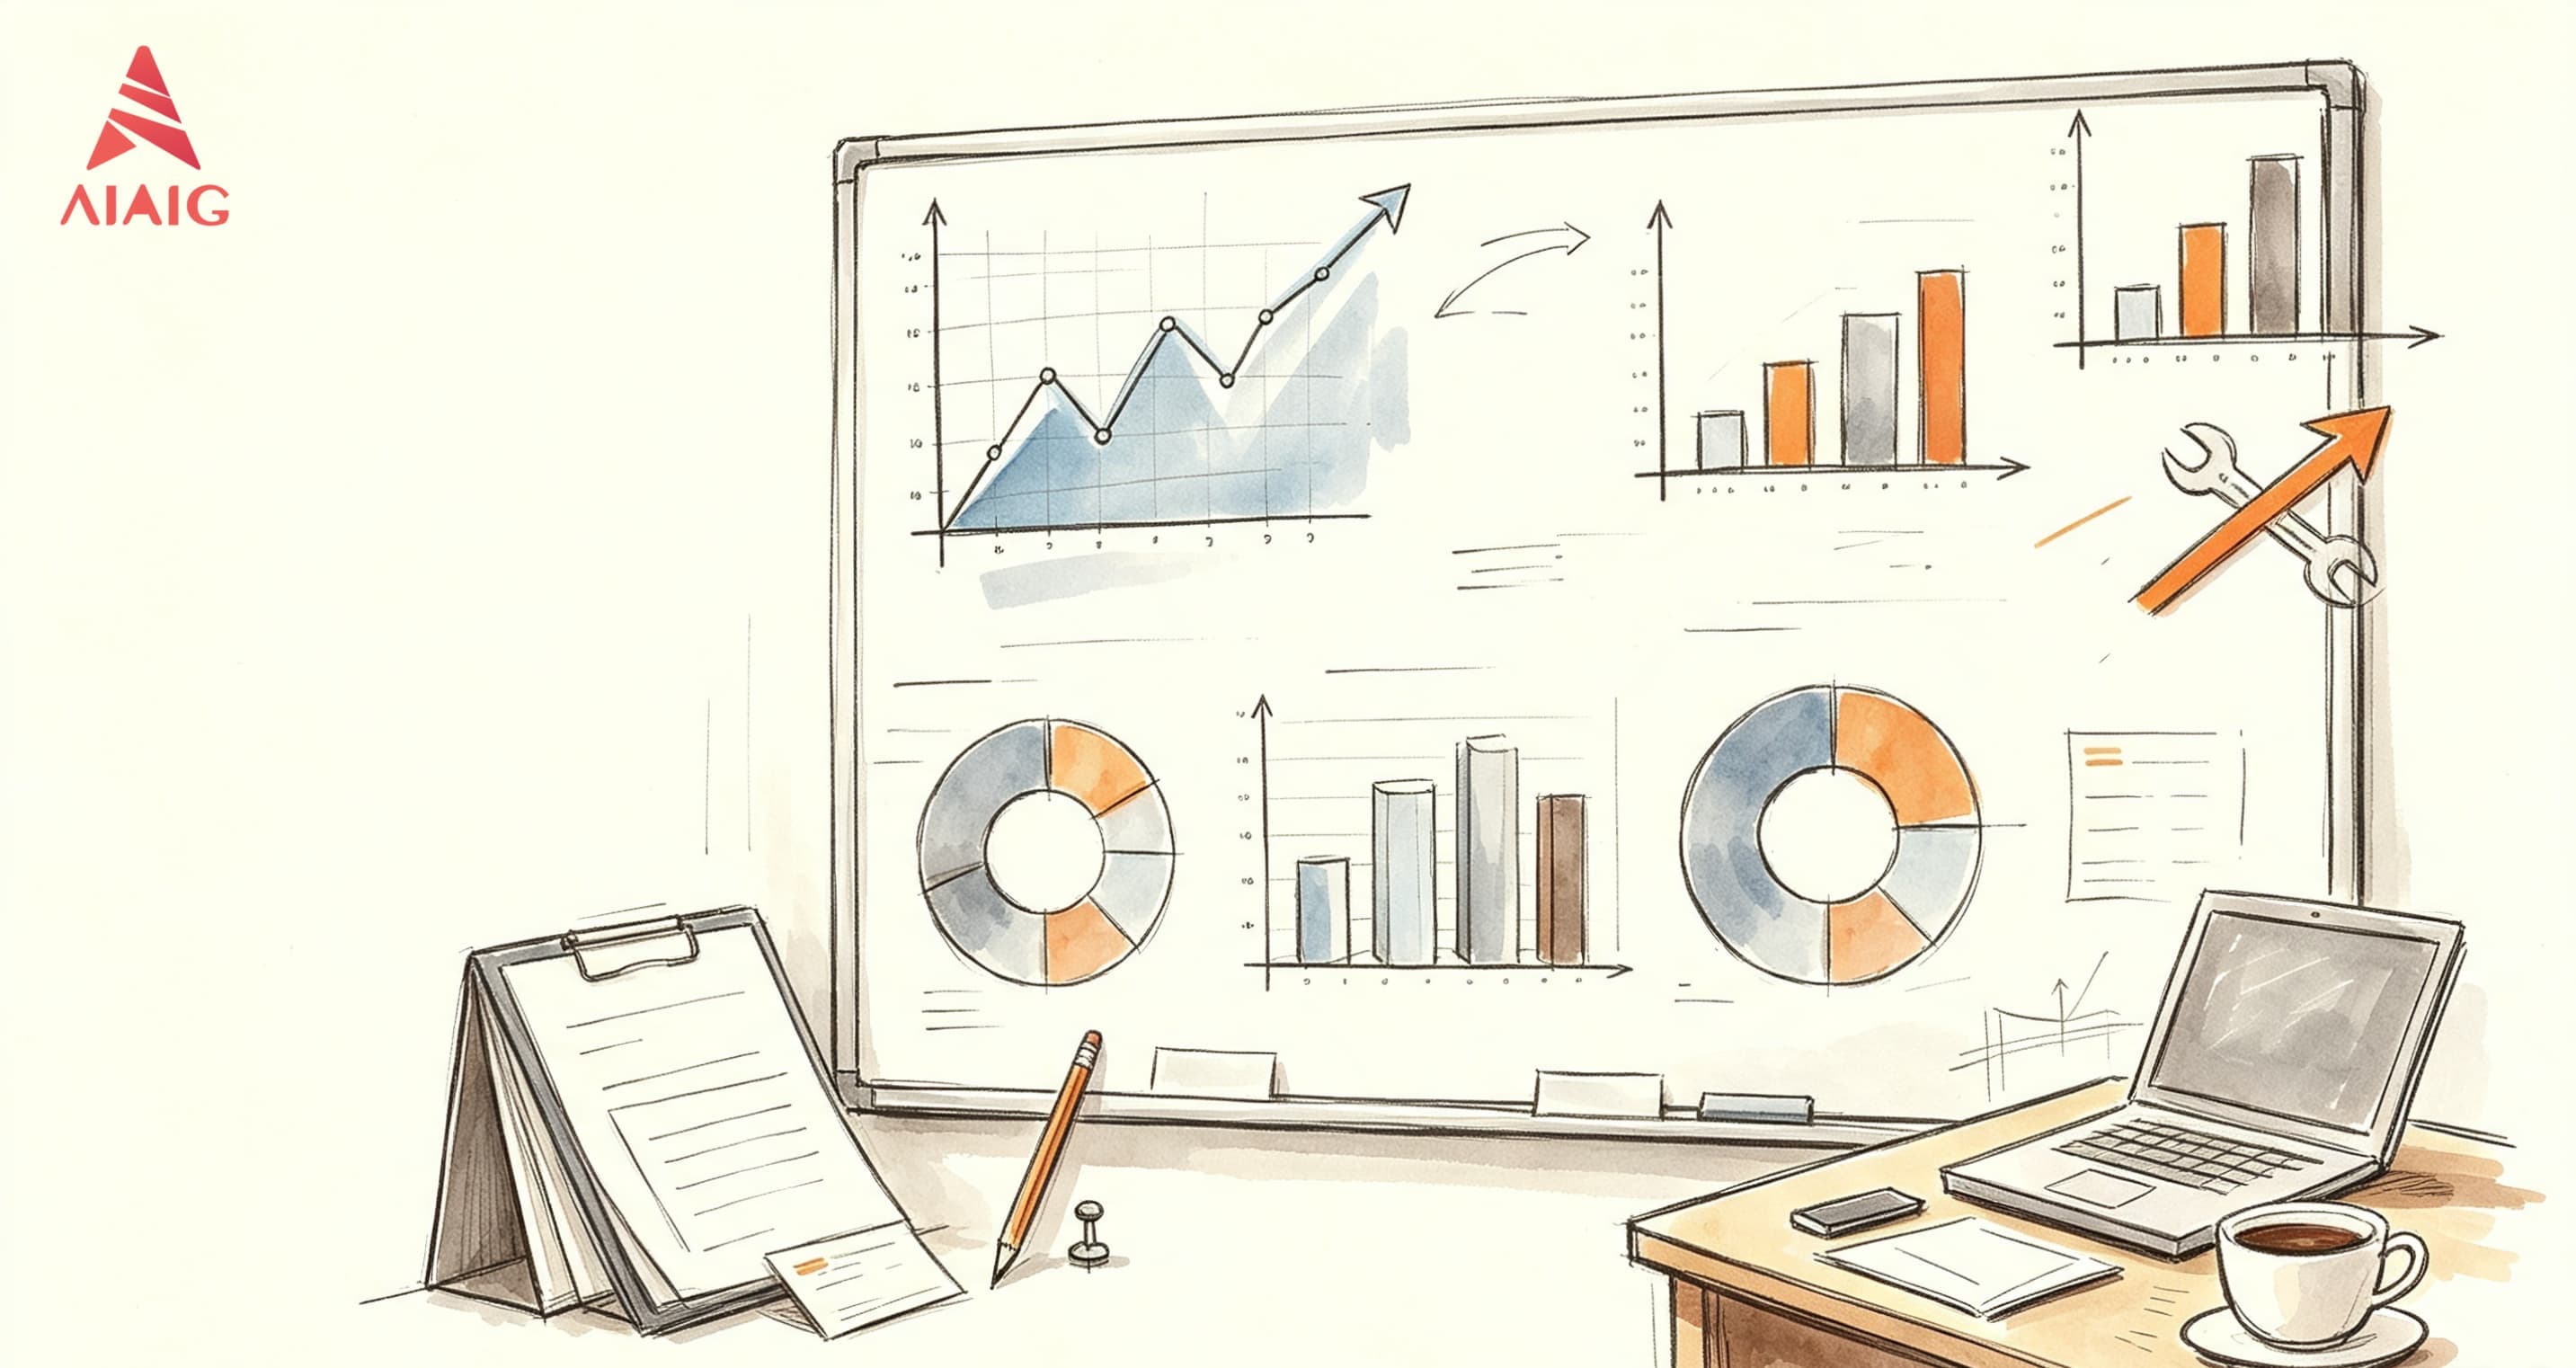
India 2026: Multiple Economic Signals Converge
In South Asia's largest economy, a set of latest macro data is simultaneously pointing in the same direction: robust expansion momentum, steadily rising asset prices, and improving consumer confidence. GDP grew 7.80% year-on-year in Q1 2026, among the highest in large economies; the NHB Residex housing index rose to 104.51 in Q1, up from 102.32 in the prior quarter; the July consumer confidence index rose to 96.50, continuing its recovery from 95.40 in May. Meanwhile, June industrial output grew 7.30% year-on-year, and June tourist arrivals reached 584,000, rebounding strongly from May.
Q1: Why is India's housing index rising? What does it signal to foreign investors?
The NHB Residex housing index rose to 104.51 in Q1 2026, up from 102.32 in Q4 2025, continuing a steady upward trend. Three forces support property prices: the income effect of high economic growth, rigid demand from an expanding urban middle class, and institutional capital flowing into quality projects in major cities.
For overseas investors, India's property opportunity rests on the long-term logic of a demographic dividend plus urbanization. However, India imposes identity and foreign exchange (FEMA) restrictions on individual foreign home buyers; most investors participate indirectly via institutions or equity, which should be clarified in advance.
Q2: What do rising consumer confidence and industrial output mean?
The July consumer confidence index rose to 96.50 from 95.40 in May, while June industrial output rose 7.30% year-on-year, showing a robust production side. Stronger confidence typically leads private consumption, and combined with industrial growth, India is in a phase of dual-driven domestic demand and manufacturing, supported by policies such as PLI schemes.
Q3: How to read FDI inflows and employment?
FDI inflows reached about USD 6.068 billion in May, at a solid level; unemployment held near 5.50% (June), a relatively stable band. Sustained FDI reflects global supply chains diversifying beyond China, with India absorbing some electronics, pharma and services production. Stable employment underpins the consumption base.
Q4: What do wages and tourism data reveal?
Average monthly wages rose to about INR 22,699 in 2025 from INR 21,455 in 2024, reflecting nominal income improvement; June tourist arrivals reached 584,000, up from 517,000 in May. Income growth and tourism recovery both confirm rising economic activity, creating a friendlier environment for overseas Chinese to invest, do business and travel.
AIAIG View: Understanding the India Allocation Window
India's high growth, the synchronized recovery of house prices and consumer confidence, and sustained FDI form a multi-signal allocation window. For overseas Chinese, India's value lies in its unmatched growth scale and demographic structure, not short-term cycles.
Suggestions: adopt a long-term view of Indian assets and avoid chasing hot spots; choose transparent, compliant indirect routes given FX and identity constraints; and focus on major cities and policy-encouraged industrial belts for more certain growth anchors. India is volatile, so allocate moderately and in tranches.